Each apartment's profitability, with the figures in front of you.
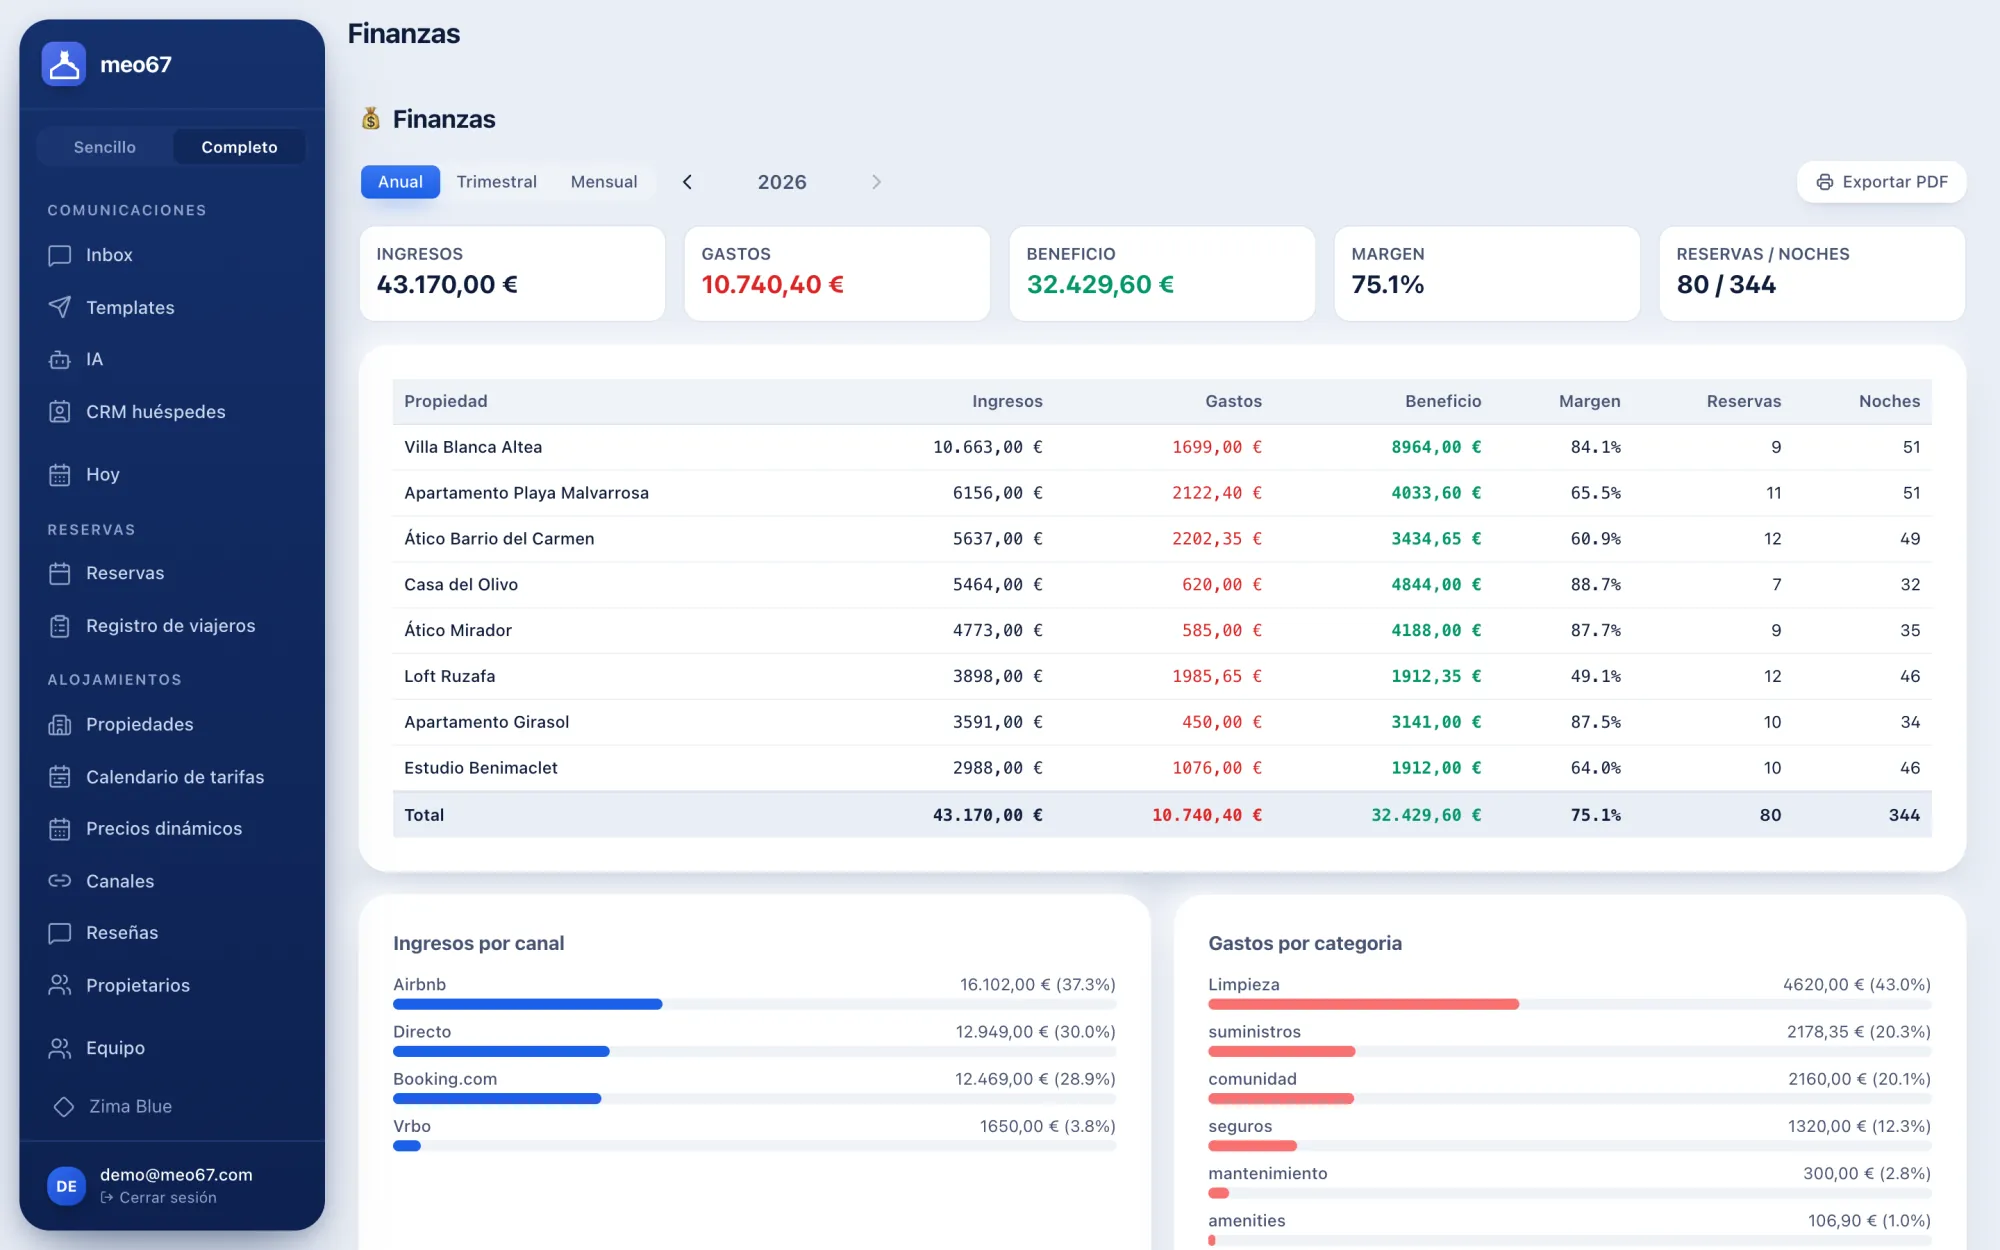
The meo67 profitability dashboard brings together income, expenses and net results by property, along with monthly occupancy, average daily rate (ADR) and revenue per available unit (RevPAR).
Enquire for my properties
Who it is for
Managers who want to compare their properties' activity and costs, understand trends and distinguish occupancy from profitability.
Revenue, costs and margin for each property
Profitability features
Net profitability and income versus expenses by property.
Monthly occupancy and activity trends.
Average daily rate (ADR) and revenue per available unit (RevPAR).
How it works day to day
- 01
Bring activity together
View income and occupancy associated with your properties.
- 02
Review costs
Include a view of each property's expenses.
- 03
Compare indicators
View net profitability, occupancy, ADR and RevPAR in context.
- 04
Decide what to review
Identify properties, periods or costs that need attention.
Example: high occupancy, different results
Two properties can have similar activity and finish the period with different results. By reviewing income and expenses by property, you may find that one has higher maintenance costs. The dashboard lets you investigate that difference without using occupancy as the only indicator.
How it connects with the rest of meo67
The profitability view complements the channel manager and invoice analysis. Bookings show activity; expenses help explain how much remains after operating the property.
Read the metrics together
A higher average rate may coincide with fewer nights sold, and high occupancy can come with higher costs. Review indicators over comparable periods and check the quality of recorded income and expenses. The dashboard organises information; decisions depend on your business context.
Profitability questions
Can I view each property separately?
Yes. The module covers income versus expenses and net profitability by property.
Which indicators are included?
Net profitability, income, expenses, monthly occupancy, ADR and RevPAR.
What is ADR?
It is the average daily rate of units sold. It helps you understand the average rate achieved and should be read alongside occupancy.
What is RevPAR?
It is revenue per available unit. It relates accommodation revenue to available capacity and complements ADR.
Keep exploring meo67
Product content reviewed on .